1,756 UI Cases: 76–79% Lower Frame Intervals, 56% Less JS Heap
1,756 real native UI cases on one canvas. Pan/zoom p95 frame intervals fell by 76–79%. JavaScript heap fell by 56%. Demo/Play, clickable flow links and retained state passed regression checks.
| Measurement · lower is better | Before | v0.11.0 | Reduction |
|---|---|---|---|
| Chromium pan/zoom p95 frame interval | 108.1 ms | 25.7 ms | 76% |
| WebKit pan/zoom p95 frame interval | 191 ms | 41 ms | 79% |
| Chromium overview JS heap | 148.2 MiB | 65.3 MiB | 56% |
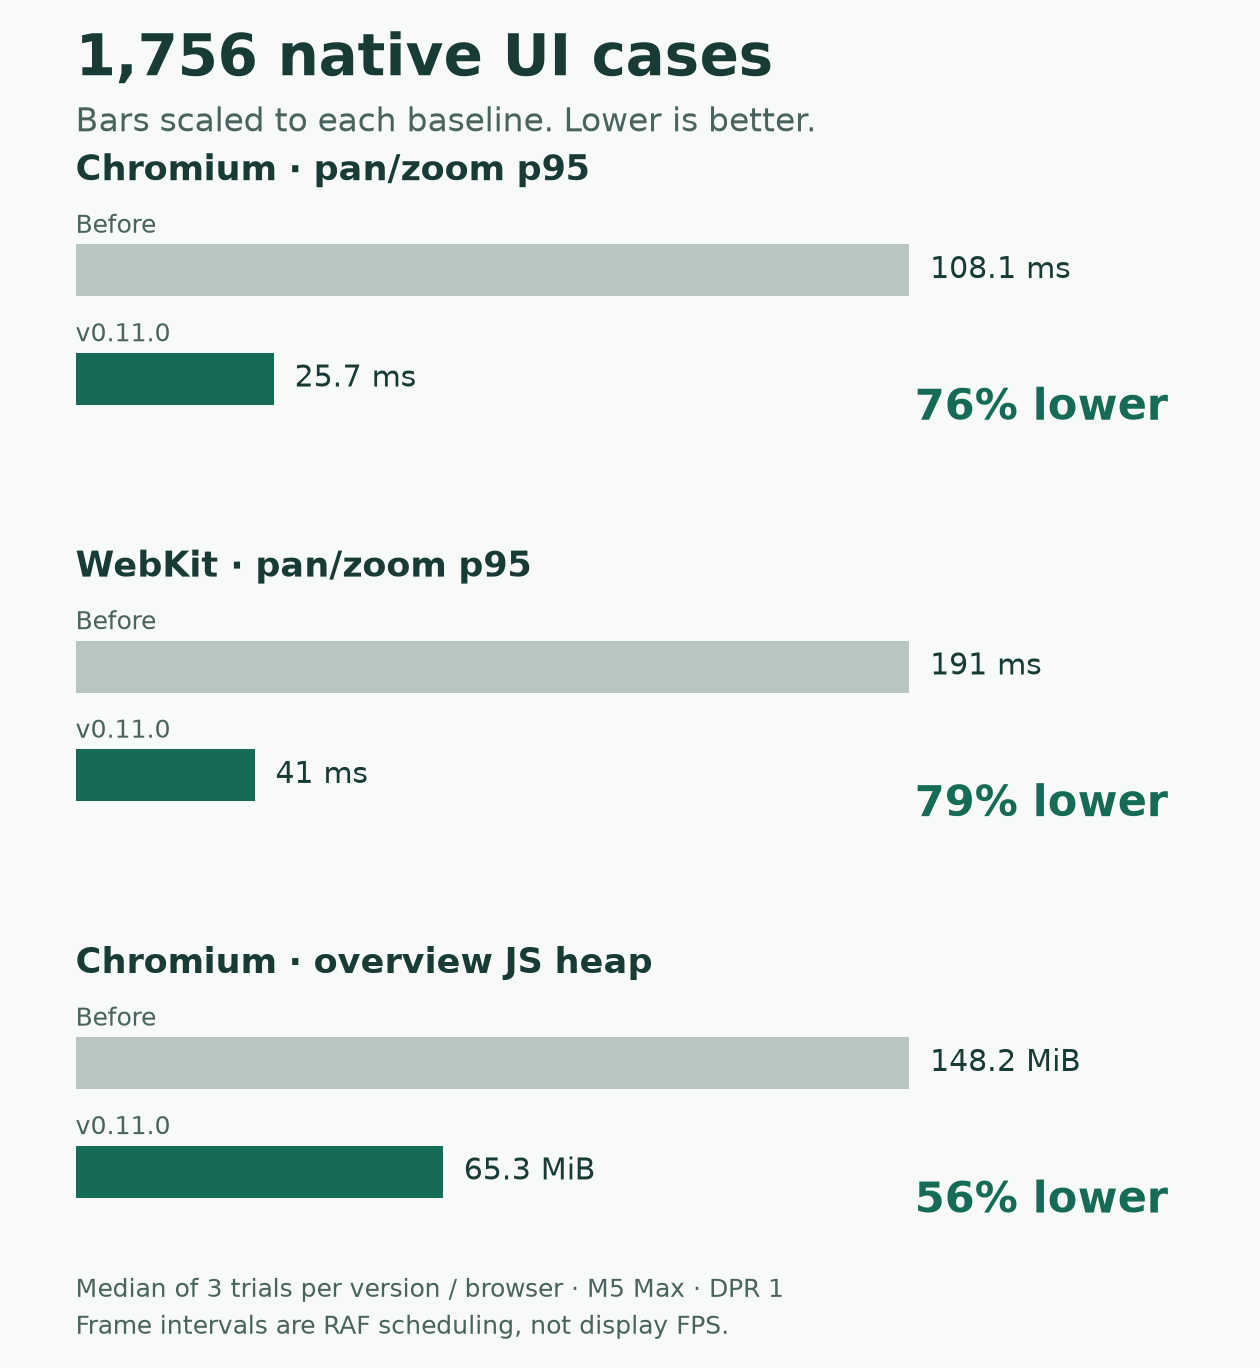
The cases are distinct screens and states from a real application. Both versions received the same frozen catalog, captures and journeys. This measures the integrated viewer, including its original adapter and player.
The problem: an overview doing too much work
App Canvas puts an application’s screens, states and flows together. You zoom out to understand the app, then select a screen to inspect or interact with it.
At 1,756 cases, moving the camera rebuilt too many graph objects. Passive native captures also carried expensive card bodies and application frames. The overview was paying for interaction before anyone interacted.
The change: give the overview a cheaper rendering path
I separated passive native display from active interaction:
- Draw native captures together. A texture atlas packs the captures into one image. A WebGL layer draws them using the graph’s existing camera.
- Reuse graph data. Camera movement reuses stable node projections instead of rebuilding the whole catalog.
- Keep original runtimes available. Selection and interaction use the original adapter. Retained frames stay mounted, preserving their document and draft state.
At whole-app overview, passive native application iframes dropped from eight to zero, and heavy card bodies from 128 to zero. All 1,756 capture images were drawn; graph IDs, hit targets and flow links remained available.
Web and React screens continue using source DOM. The native atlas path is opt-in, with the original renderer available when GPU or atlas validation fails.
Proof beyond a faster benchmark
The comparison used 12 fresh-process trials: three runs per version in Chromium and WebKit, alternating order. Each performed actual mouse drags and wheel events. The table reports the median of each trial’s p95 frame interval.
Pixel checks verified every capture across overview and closer views. Separate browser checks exercised React input/save, continuing Demo/Play, cross-page flow links, and draft retention through navigation, filters and player exit. They also tested checksum failures, unavailable WebGL, texture allocation failure and context loss.
Linux release qualification caught a real failure: WebKit uploaded and drew the texture correctly, yet presented blank output. Retaining the last drawing buffer fixed that event-driven rendering path. I reran the full paired benchmark after the fix, with the pixel gate unchanged.
No functional regression was observed in the tested scope. The exact packaged release and public hosted viewer were also verified.
These measurements used an M5 Max with 128 GiB RAM at DPR 1. Frame intervals measure browser scheduling during input, not display FPS. JS heap excludes GPU memory; atlas preparation is excluded from viewer timings. Physical mobile performance remains unqualified for this native overview workload.
The useful improvement came from doing less work while preserving the interaction path people actually use.
Full methodology and all trial results · v0.11.0 release · Try the public synthetic demo